This article is part of a series focusing on the most underrated players at each position based on batter run value. The links to the first four articles in the series can be found below. The first article in the series includes a brief introduction to the topic.
One basic premise when comparing players’ batting values is that not all players are playing in the same environment—baseball analytics aim to normalize two key environmental factors: era factors and ballpark factors. Era factors aim to measure how statistics differ from year to year. For instance, offensive statistics surged during baseball’s steroid era. 1998 was the year that brought baseball back to the forefront for many fans who had a bad taste in their mouths after the strike-shortened 1994 season. Fans tuned in to see if Mark McGwire and Sammy Sosa could surpass Roger Maris’ single-season home run record. During that time, offense was up across baseball, with the league’s average on-base plus slugging percentage (“OPS”) at .755 and 85 different players surpassing the .800 OPS mark. That is much higher than the current offensive outlook in the game. The 2024 league average OPS was .711, and only 29 players surpassed the .800 mark. Era factors are utilized in order to normalize offensive statistics based on the average offensive output during a particular period. In essence, how does a player perform compared to his peers during the time he is playing?
Another environmental variable that analytics accounts for is ballpark factors. Each team will play half of their games at their home ballpark (with some exceptions for special events, such as games in other countries, The Little League Classic in Williamsport, PA, and The Field of Dreams Game in Dyersville, IA), while playing their remaining games at other major league stadiums. One of the beautiful things about baseball is that each ballpark has unique characteristics; the fields are not uniform, unlike those in most other sports. One exception is soccer, which allows field configuration variations of 110-120 yards in length and 70-80 yards in width. All MLB parks must adhere to a few standard requirements. The pitching mound must be 60 feet 6 inches from home plate, and the bases must be configured in a 90-foot by 90-foot square. The bases must also be uniform in size. However, each ballpark is constructed in a unique configuration, making all of the venues distinctive.
These unique characteristics have significant impacts on baseball’s gameplay. For example,
“The Green Monster” at historic Fenway Park in Boston sits 310 feet from home plate, providing a decided advantage to right-handed pull hitters and left-handed hitters who can drive the ball to the opposite field. In contrast, the fabled “Short Porch” at Yankee Stadium provides advantages to left-handed pull hitters. A ballpark’s location can also significantly impact its offensive profile. One example of this is the effect of the marine layer at the West Coast stadiums. The marine layer is a weather phenomenon that occurs when warm air travels across the surface of the Pacific Ocean, causing it to become colder and therefore denser. This cool, dense air gets trapped beneath the warmer air on land. The thick air decreases the distance of balls hit in the air, resulting in lower offensive output compared to ballparks in other locations.
The “ballpark factor” is a statistic that accounts for the unique characteristics of each park, which influence the run-scoring environment. Ballpark factor is determined by taking the runs scored by Team X and its competitors in Team X’s home ballpark and dividing that figure by the runs scored by Team X and its competitors in Team X’s road contests. For example, if 700 runs were scored at Wrigley Field, and 750 runs were scored in Cubs games away from Wrigley Field, Wrigley Field’s park factor for that season would be 0.9333. Notably, the park factor will be slightly adjusted if a team does not play the same opponents at home as it does on the road. Ballpark factor is useful in determining the extent to which a park favors hitters or pitchers. It is not affected by the teams or players involved, because they also play games in other stadiums. Park factor simply compares how easy it is to score, from one ballpark to another.
The Colorado Rockies’ home ballpark, Coors Field, sits at an elevation of 5,280 feet, a mile above sea level. Due to the location of the field, the air is significantly thinner and drier than in any other major league ballpark. This has a significant impact on the trajectory of batted balls, allowing them to travel farther. It is widely known that the conditions at Coors Field make it extremely hitter-friendly. The MLB even implemented a program to keep game balls in humidors in order to minimize the impact of the altitude. However, Coors Field remains the most offense-friendly ballpark in Major League Baseball.
It’s no surprise that Coors Field has the highest ballpark factor of all 30 stadiums. The park conditions significantly boost the Rockies’ hitters’ statistics in home games, providing a clear example of the influence of park factors on player performance. This is clearly demonstrated, for instance, by the offensive statistics of Colorado’s center fielder Brenton Doyle. He became the everyday center fielder for the Rockies in 2023. During that season, he demonstrated his value as an elite defensive center fielder, leading the MLB in fielding run value and securing the National League Gold Glove. However, there were concerns about Doyle’s offensive production. He had a 53 OPS+, meaning his offensive performance was 47% below league average.
It is worth noting that “plus stats” are adjusted for league and park conditions. This is the case for widely used statistics such as OPS+, wRC+, and ERA+. The statistics are normalized across the entire league and are adjusted so a value of 100 is league average, which serves as a baseline. For instance, Shohei Ohtani’s OPS+ of 190 indicates that his offensive output is 90% better than the league average, as measured by this statistic.
Doyle’s offensive output significantly improved in 2024. He finished the season with a 104 OPS+, indicating that his performance at the plate was 4% above league average. He also secured a second consecutive National League Gold Glove Award. Notably, Doyle’s road batting splits were significantly lower than his home batting splits and well below the league average.
A ‘split’ is a crucial concept in baseball statistics, representing any statistic broken down into smaller subcategories. Commonly used splits include performance against right-handed versus left-handed pitchers (often referred to as “platoon splits”), home versus road performance, statistics during specific months of the season, as well as offensive output in different situations (such as runners on base, number of outs, etc.). Understanding these splits can provide deeper insights into a player’s performance and is a key aspect of baseball analytics.
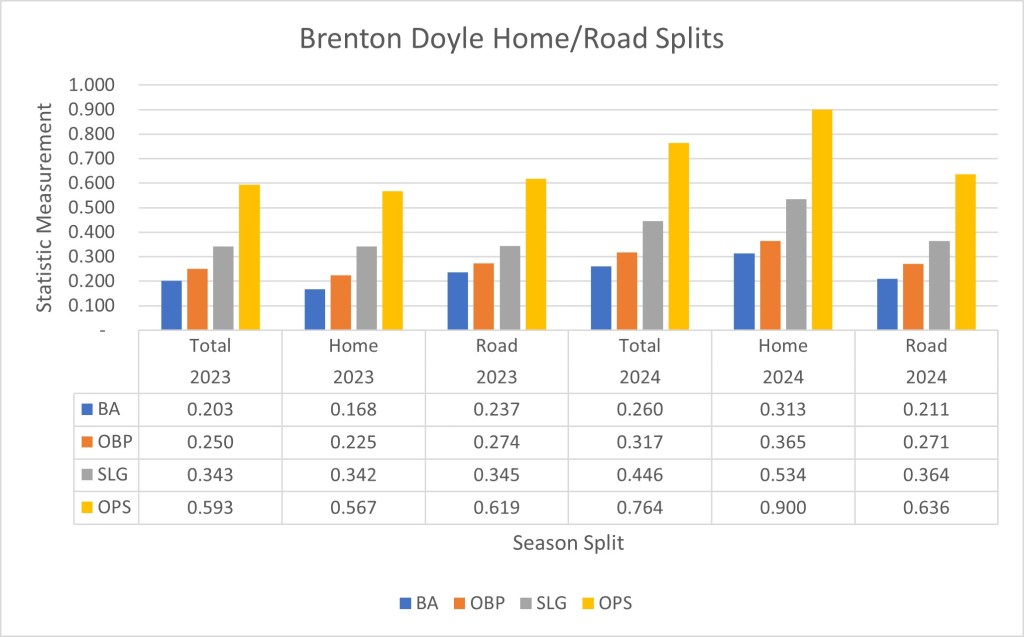
Doyle improved his OPS from .593 in 2023 to .764 in 2024. His OPS at home skyrocketed from a dismal .567 in 2023 to an elite level .900 last season. However, his OPS on the road only improved incrementally from .619 in 2023 to .636 last season. Why did his offensive output improve so significantly at Coors Field? One possibility could be the changes to his batted ball profile. Doyle’s average launch angle increased from 11.7 degrees in 2023 to 13.2 degrees in 2024. This caused his ground ball rate to decrease from 49.6% in 2023 to 40.4% in 2024, resulting in a higher percentage of fly balls and line drives. As previously discussed, the thin air at Coors Field allows balls hit in the air to carry farther. Although Doyle’s adjustments improved his overall offensive game, the benefits of these changes are particularly tailored to increased productivity at his home ballpark.
Doyle’s significant improvement in offensive output in 2024 pleasantly surprised those who appreciated his defensive capabilities but knew he had to produce at the plate to stay in the big leagues. He demonstrated his ability to make adjustments, which contributed to increased success last season. Doyle provides significant value to his team with his elite defensive run value. He could transition from a defense-first player with a bat that can stick in the lineup to one of the game’s elite all-around players if he continues to improve offensively, especially on the road.

Leave a comment